🔍 From Data to Insight: My Interactive Shiny App for House Price Analysis
(Built in 2024)
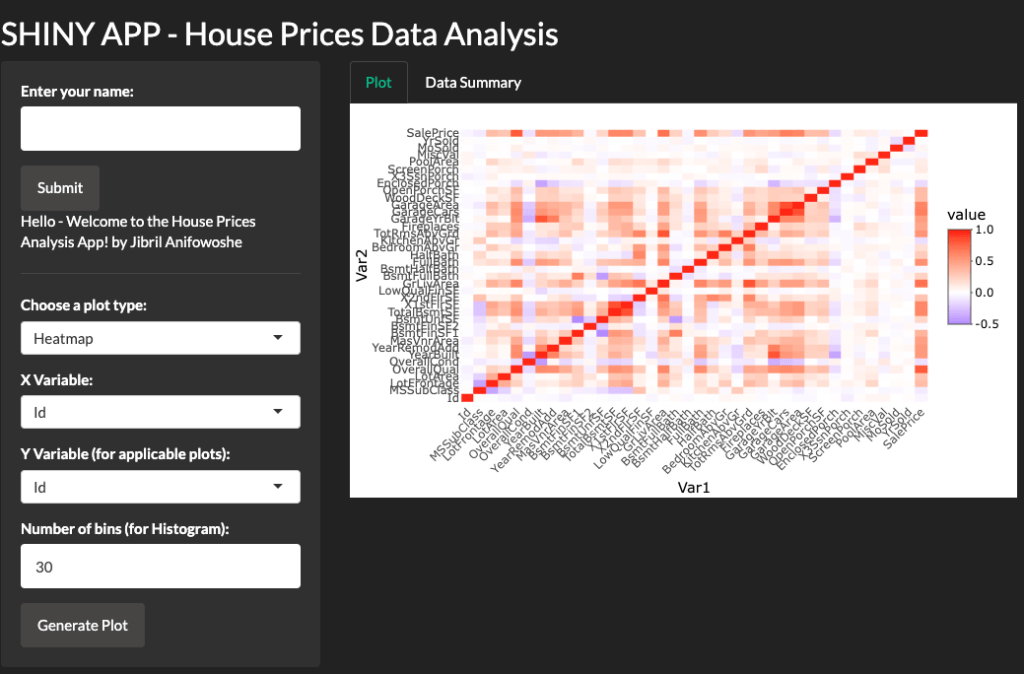
🏗️ In early 2024, I designed and deployed an interactive R Shiny web application to visualize housing market patterns using Kaggle’s “Advanced Regression Techniques” dataset.
What started as an academic experiment quickly evolved into a professional-grade platform, blending data science, visualization, and cybersecurity engineering to demonstrate how structured, reproducible pipelines can generate insights securely and responsibly.
💡 The app allows users to dynamically explore data through histograms, scatter plots, heatmaps, and more, enabling both technical and non-technical audiences to uncover meaningful relationships between housing features and pricing.
🔐 Bridging Cybersecurity + Data Science
This project reflects my philosophy that data integrity is as vital as analytical accuracy.
I built the entire pipeline with secure preprocessing in Jupyter Notebook, automated dependency management in R, and reproducible version control for transparent governance.
It’s a small example of how cyber-minded engineering can enhance trust and scalability in data-driven systems.
🚀 Explore the Project
👉 Live App: View on ShinyApps.io
📂 Source Code: Explore on GitHub
💼 Connect: LinkedIn Profile – Jibril Anifowoshe
